Expedia Group shares Backstage proof of value metrics 2.0
Editor's Note: In this post, Expedia Group provides a follow-up to their initial Q4 2021 post on how they measure Backstage proof of value. We're grateful to the Expedia Group team for sharing their processes, revised proof of value metrics, and adaptations to their approach over time in hopes of providing a successful framework for the rest of the Backstage community.
Expedia Group's mission is to power global travel for everyone, everywhere. This vision is made possible through Expedia Group's massive platform, which connects 168 million loyalty members, 50 thousand B2B partners, 3 million properties and 500 airlines, car rentals and cruise lines across the globe. In short, the scale of our platform is enormous, which means that we need to scale our engineering capabilities as well so we can continue to provide seamless experiences to our travelers and partners.
In August 2020, we adopted Backstage to enhance our foundational platform capabilities and reduce developer friction in the process. Its framework proved scalable for us and as EG's platform evolved, so did our application of Backstage. Since our initial share about our Backstage deployment, we've continued to follow our process of:
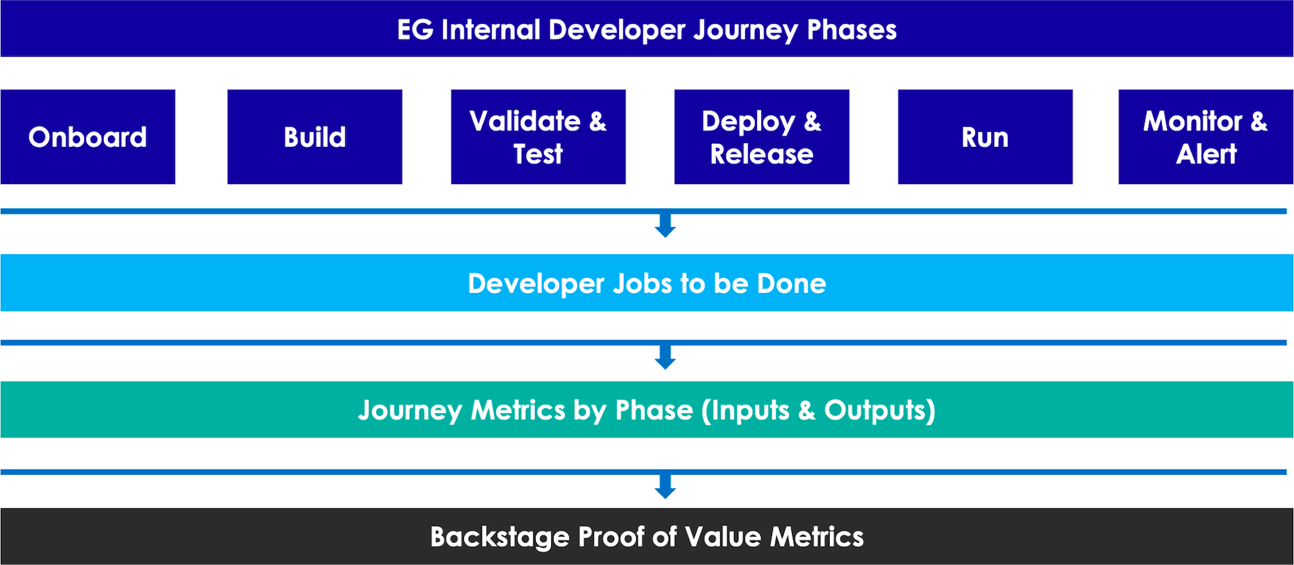
- Syncing Expedia Group's internal Developer Journey phases by key DevOps processes and Software Delivery Life Cycle (SDLC) milestones (POC, Alpha, Beta, etc).
- Identifying Developer Jobs to be Done (JTBD) by our Internal Developer Journey phases
- Aligning developer JTBD's to proof of value (PoV) metrics.
In the diagram below, you can see how we distilled these processes into Backstage PoV metrics.
To ground ourselves in the evolving developer and Backstage landscape at Expedia Group, we constantly ask ourselves, "How can we continue to show the value of Backstage to our customers and the Developer Community?" To fully answer this question, we adapted our initial proof of value metrics to reinforce our alignment to the current landscape of the Expedia Group developer journey.
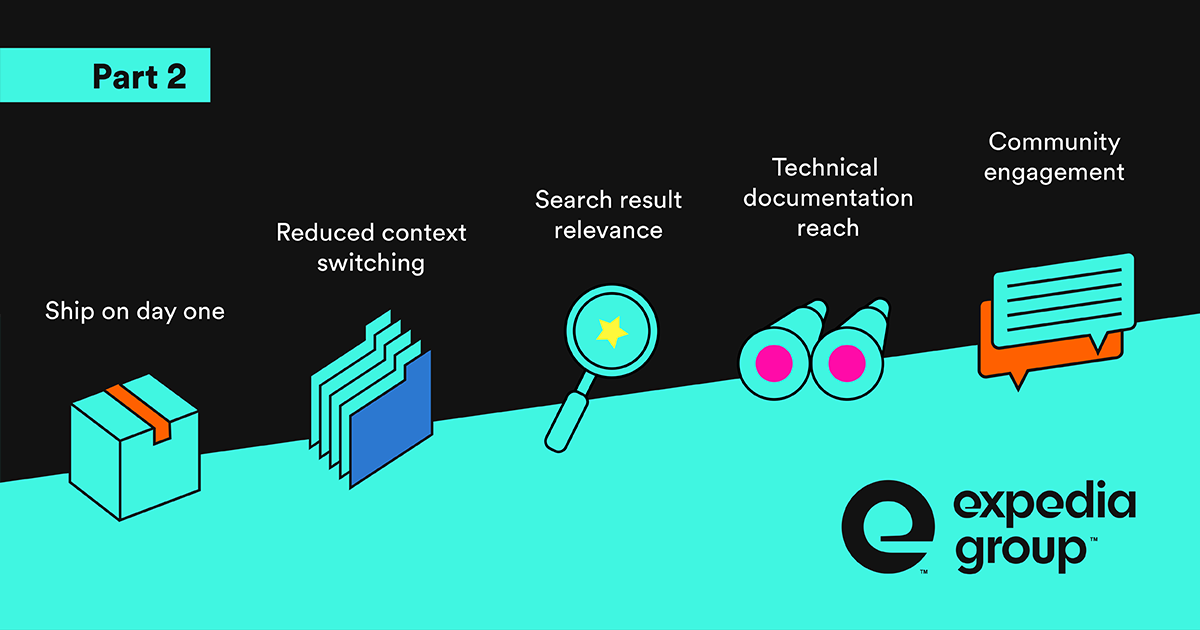
Expedia Group proof of value metrics 2.0
We are excited to share our PoV metrics because it affirms our investment in Backstage for Expedia Group's Backstage users and provides a compelling metrics-based answer on why more organizations should consider adopting it.
As our Backstage application matured, we updated our PoV metrics and aligned our 2023 roadmap to reflect these changes. Below, we highlight key wins from 2022 and outline our long-term vision for each metric.
| PoV Metric | Description | 2022 Key Win(s) | Long-Term Vision |
|---|---|---|---|
| "Ship on Day One" / onboarding metrics | A metric used to determine an engineer's readiness to develop at EG during their onboarding process. It measures the time from first commit to deploying code in production, using a "Hello World Template" |
|
|
Reduce context switching through integration with core EG capabilities | Through plugins, tool integration, reduces context-switching as engineers will not need to toggle between multiple tools |
|
|
| Improve search results relevance | Intuitive search capabilities to surface relevant Backstage content like TechDocs, entities, tools, etc. |
|
|
| Technical documentation reach | Number of developers leveraging TechDocs for all services within EG |
|
|
| Developer Experience community engagement | Enhance Backstage through community engagement |
|
|
YMMV: Your Metrics May Vary!
Measuring the value of Backstage will vary depending on your organization's needs and priorities. As an early adopter of Backstage, we hope the Expedia Group PoV metrics provide a helpful framework for understanding how Backstage can be used to improve developer productivity, collaboration, and knowledge sharing.
We look forward to sharing future updates with the community as we continue to embrace a continuous improvement approach to Backstage. If you missed it, you can read about where we started in our initial proof of value metrics back in 2021.
Read more about Expedia's tech journey on their Medium Blog